IPv6 Crosses 50%: The 28-Year Milestone
On 28 March 2026, Google's IPv6 statistics crossed a line that seemed perpetually out of reach: 50.1% of traffic to Google services arrived over IPv6. For a protocol first specified in RFC 2460 in December 1998, and for an internet that has been running on an address scheme designed for a few billion devices while connecting tens of billions, this is a structural shift, not just a statistic.
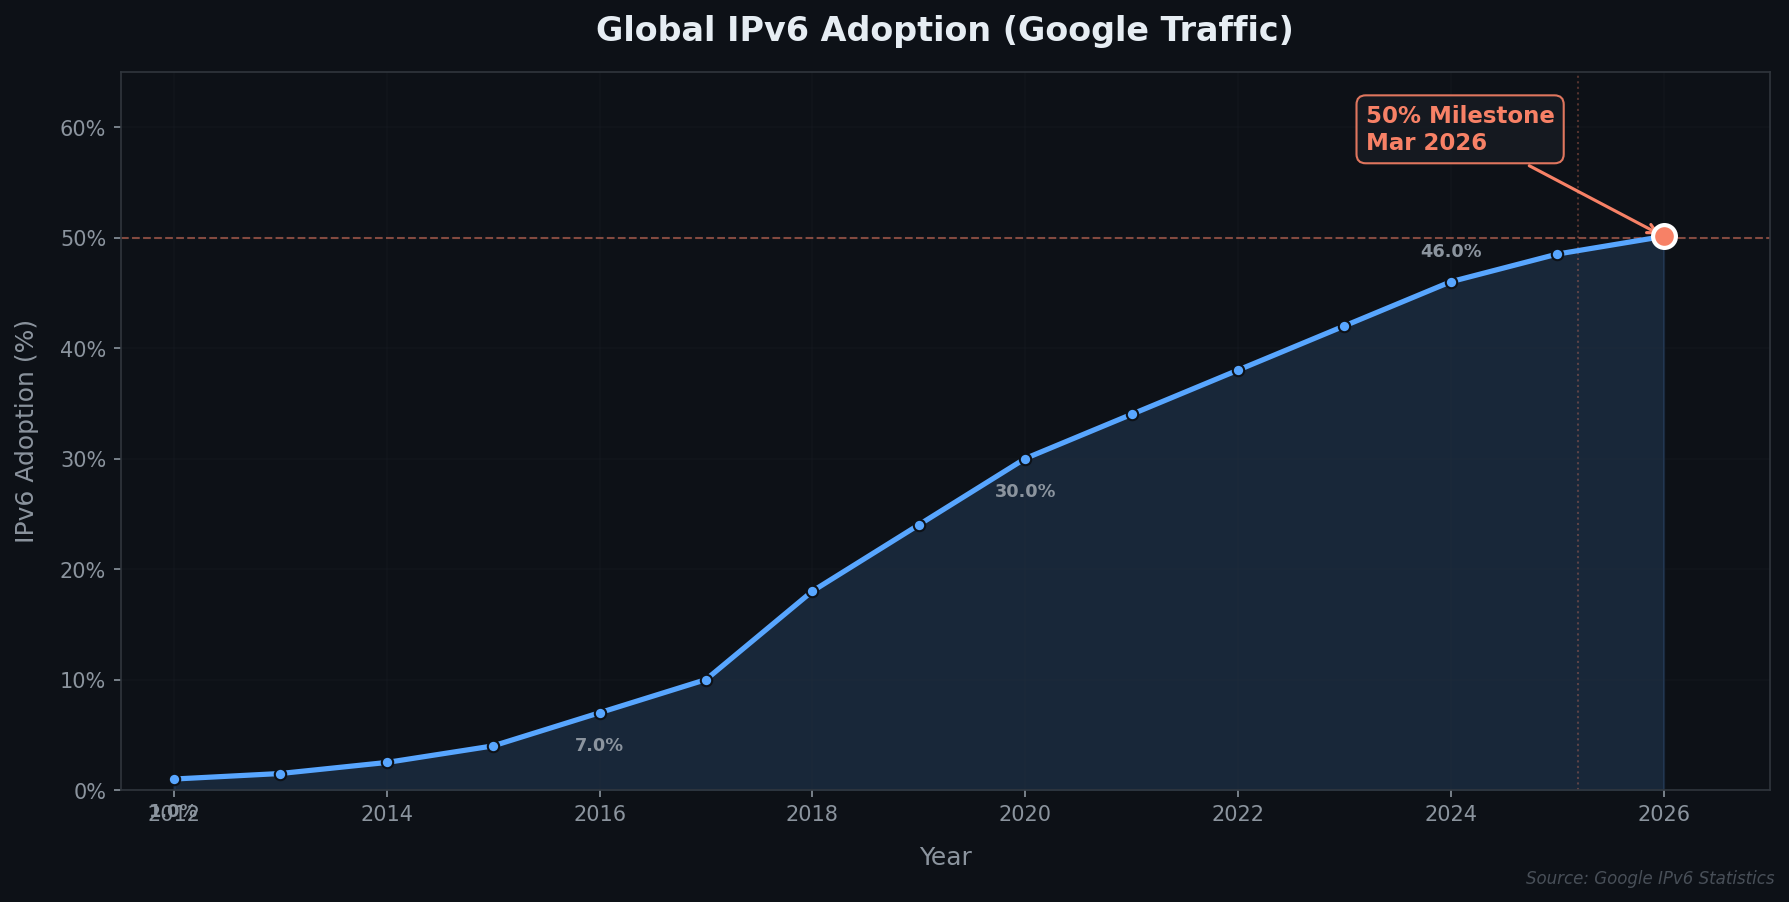
Figure: Global IPv6 adoption trends from 2012 to 2026, showing the milestone crossing of 50% in March 2026.
The measurement landscape
Different organisations measure IPv6 adoption differently, and the numbers don't always agree:
- Google: 50.1% of traffic to Google services (the milestone marker)
- Cloudflare: 40.1% of HTTP requests across its CDN
- APNIC: 43.13% of networks have IPv6 capability
The discrepancy reflects measurement methodology. Google measures traffic from end users who have successfully connected over IPv6. Cloudflare measures HTTP requests, which includes traffic from IPv6-capable networks that may still prefer IPv4. APNIC measures network-level capability, which is a superset of actual usage. All three show the same trend: accelerating adoption.
Why it took 28 years
IPv4 addresses 4.3 billion devices. The internet connected its 4.3 billionth device roughly a decade ago, and has since relied on Network Address Translation (NAT) to stretch the address space. NAT works, but it breaks end-to-end connectivity, complicates peer-to-peer protocols, and adds latency.
IPv6 provides 340 undecillion addresses. The protocol itself has been ready since 1998. The delay came from three compounding factors:
Carrier inertia. ISPs had invested billions in IPv4 infrastructure and saw no revenue upside in deploying IPv6. The turning point came when IPv4 address exhaustion made NAT unavoidable, and maintaining increasingly complex NAT stacks became more expensive than deploying IPv6.
Application compatibility. Early IPv6 deployments exposed bugs in operating systems, routers, and applications that assumed IPv4. These have been largely resolved, but legacy systems in enterprise environments still pose problems.
No killer application. For most users, IPv4 with NAT works fine. Web browsing, email, and streaming all function behind NAT. The benefits of IPv6 (simpler networking, better peer-to-peer, no NAT overhead) are invisible to end users. The transition happened not because users demanded it, but because operators were forced into it.
Regional disparities
Adoption is not uniform. Asia-Pacific crossed the 50% threshold in 2025, driven by aggressive IPv6 deployment in India, Japan, and South Korea. North American adoption has been steady but slower, hampered by large cable operators with deep IPv4 investments. European adoption sits between the two, with Germany and France leading.
The GitHub gap
The Hacker News discussion (794 points, 583 comments) quickly identified a notable holdout: GitHub still does not support IPv6. For a platform that serves as critical infrastructure for much of the software development world, this is a conspicuous gap. Git operations, API calls, and package downloads all route over IPv4. The discussion produced no official response from GitHub, but the community pressure is mounting.
What changes after 50%
The practical implications of majority IPv6 adoption are significant for infrastructure teams:
- Dual-stack complexity remains the operational reality. IPv4 will not disappear. Organisations must maintain both stacks for the foreseeable future, which means continued complexity in firewall rules, monitoring, and debugging.
- NAT traversal becomes simpler for IPv6-connected peers. Applications that use WebRTC, peer-to-peer file transfer, or IoT device communication benefit from native end-to-end connectivity.
- IoT scalability improves. The address space pressure that forced NAT on IPv4 networks disappears for IPv6-only device fleets.
- The "last mile" problem persists. Home routers, small business networks, and legacy IoT devices still run IPv4. The transition will be complete when the last IPv4-only device is decommissioned, which could be decades away.
The 50% mark is psychological as much as technical. It signals that IPv6 is no longer the future of the internet. It is the present.