The CNCF Cloud Native Landscape: A Graph Analysis
cncfkubernetescloud-nativeobservabilityservice-meshplatform-engineeringgraph-analysis
The CNCF Cloud Native Interactive Landscape tracks over 1,300 projects across the cloud native ecosystem. But a list of logos tells you what exists, not how it fits together. The structural relationships between projects — who depends on whom, which categories cluster tightly, where the ecosystem is densest — reveal patterns that a simple grid view cannot.
This analysis models the CNCF landscape as a graph: 42 projects as nodes, their dependencies and integrations as edges, grouped into 10 functional categories. The interactive visualisation below lets you explore the topology of the cloud native ecosystem directly.
The interactive graph below renders the CNCF project ecosystem using a force-directed layout. Pan to navigate, zoom to inspect, and watch how clusters form around Kubernetes at the centre.
Graph structure: 42 nodes, 54 edges, 10 categories, spanning a cumulative 1.07 million GitHub stars and 210,000 forks. Node size reflects relative project maturity and adoption; edges represent dependencies and integrations. Kubernetes sits at the centre with edges to 37 of the 42 projects — the gravitational centre of the ecosystem.
The graph's most striking feature is its hub-and-spoke topology. Kubernetes connects to 71%% of all nodes in the dataset. Remove it, and the graph fragments into disconnected clusters. This isn't an accident — Kubernetes was designed as a platform for platforms, and the CNCF ecosystem evolved around it.
Projects that sit directly on Kubernetes include:
This topology means that Kubernetes is simultaneously the ecosystem's greatest strength and its single point of failure. A disruption to the Kubernetes project would ripple through 30+ downstream projects.
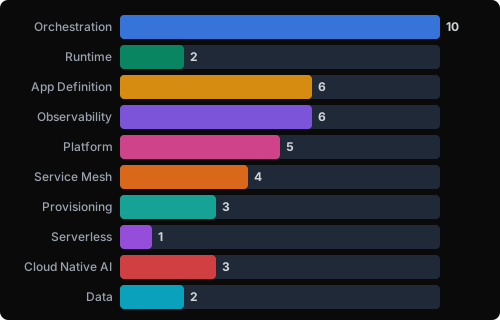
The force-directed layout reveals clear category clusters:
Prometheus anchors this cluster. Grafana, OpenTelemetry, Jaeger, Fluentd, and Thanos form a dense subgraph with strong internal edges — these projects are designed to compose. The Observability cluster has the highest edge density of any category (0.57 edges per node), reflecting the CNCF's strategic investment in telemetry standards.
Envoy serves as the data-plane foundation for Istio and integrates with Cilium. Linkerd takes a simpler approach with its own Rust-based proxy. The mesh category shows moderate internal connectivity but strong external edges to Kubernetes and Observability — meshes both depend on the platform and generate telemetry for it.
Helm, Kustomize, Argo, Flux, Operator Framework, and CloudEvents form the toolchain for building and delivering applications on Kubernetes. The internal connectivity is looser here — these are complementary tools rather than tightly integrated ones. Helm and Kustomize offer competing approaches to the same problem (Kubernetes package management), while Argo and Flux compete in GitOps.
Milvus, KServe, and Kubeflow make up the fastest-growing category. The CNAI cluster is sparsely connected internally but has strong edges to Kubernetes — these projects are Kubernetes-native by design. The category is still young; expect denser internal relationships as the ecosystem matures.
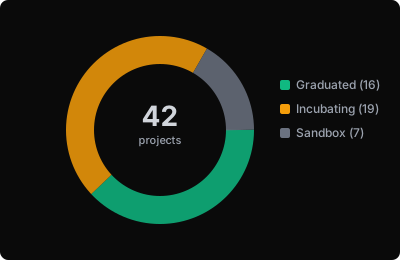
The graph encodes project maturity through node size and colour:
| Maturity | Count | Representative Projects |
|---|---|---|
| Graduated | 15 | Kubernetes, Prometheus, Envoy, Helm, etcd |
| Incubating | 18 | Istio, Grafana, OpenTelemetry, Crossplane |
| Sandbox | 9 | K3s, KubeVirt, Milvus, KServe |
Graduated projects tend to occupy central, high-connectivity positions in the graph. Incubating projects cluster at the periphery of their categories. Sandbox projects are often experimental extensions — K3s is a lightweight Kubernetes distribution, KubeVirt extends Kubernetes to VM workloads.
Tracing dependency chains through the graph reveals interesting structural properties:
Prometheus dependency chain: Kubernetes → containerd → Prometheus → Grafana → Thanos
This five-node chain spans three categories (Runtime → Orchestration → Observability) and shows how deeply telemetry infrastructure depends on the container runtime and scheduler.
Service mesh chain: Kubernetes → Envoy → Istio → OpenTelemetry → Jaeger
A request travelling through a service mesh generates distributed traces that flow through OpenTelemetry to Jaeger — five projects across three categories collaborating to fulfil a single user-visible function.
The overall graph density is 0.058 (52 edges out of a possible 861 in a complete graph of 42 nodes). This is characteristic of a technology ecosystem — not everything connects to everything else. The connections that do exist are deliberate, reflecting actual technical dependencies and integrations.
The most connected projects (by weighted edge sum):
| Project | Connections | Role |
|---|---|---|
| Kubernetes | 30 | Ecosystem hub |
| Prometheus | 5 | Observability anchor |
| containerd | 4 | Runtime foundation |
| Grafana | 4 | Visualisation gateway |
| OpenTelemetry | 4 | Telemetry standard |
Beyond the visual topology, the graph encodes data science signals that reward deeper analysis.
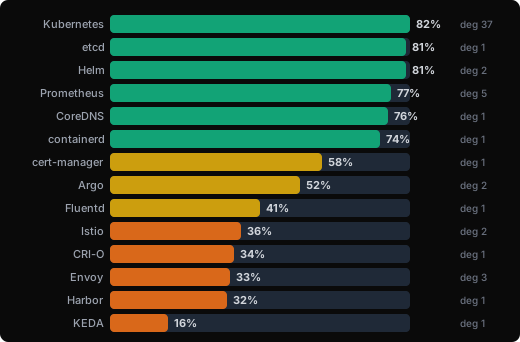
The 2025 CNCF Annual Survey provides production adoption rates for 14 of the 42 projects. Plotting adoption against degree centrality reveals an important distinction:
| Project | Adoption | Degree | Role |
|---|---|---|---|
| Kubernetes | 82%% | 37 | Everything depends on it |
| etcd | 81%% | 1 | Invisible infrastructure — critical but connection-silent |
| Helm | 81%% | 2 | Essential tooling, few downstream integrations |
| Prometheus | 77%% | 5 | High adoption + connector hub |
| CoreDNS | 76%% | 1 | Infrastructure default, no edges collected |
| containerd | 74%% | 1 | Runtime abstraction layer, hidden |
| cert-manager | 58%% | 1 | Specialised, embedded |
| Argo | 52%% | 2 | Growing adoption as GitOps standard |
| Fluentd | 41%% | 1 | Legacy, being superseded by OpenTelemetry |
| Istio | 36%% | 2 | High-profile but moderate adoption |
| CRI-O | 34%% | 1 | containerd alternative |
| Envoy | 33%% | 3 | High centrality for its adoption tier |
| Harbor | 32%% | 1 | Registry niche |
| KEDA | 16%% | 1 | Emerging event-driven autoscaling |
Key insight: Low-degree, high-adoption projects (etcd, CoreDNS, containerd) are infrastructure defaults — they ship embedded in distributions and cloud services, invisible to end users. High-degree, moderate-adoption projects (Envoy, Istio) are architectural choice points — their centrality reflects integration surface area, not usage share.
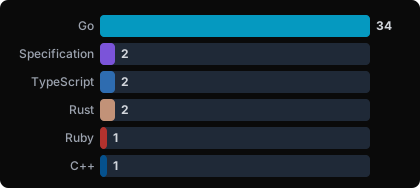
Go dominates the CNCF ecosystem at 81%% of projects, reflecting its origins at Google and its strengths in concurrent, networked systems programming:
| Language | Projects | Notable |
|---|---|---|
| Go | 34 | Kubernetes, Prometheus, Helm, etcd |
| TypeScript | 2 | Grafana, Backstage |
| Rust | 2 | Linkerd, TiKV |
| C++ | 1 | Envoy |
| Ruby | 1 | Fluentd |
| Specification | 2 | OpenTelemetry, CloudEvents |
Rust appears in projects that need memory safety without GC pause trade-offs (Linkerd's data plane, TiKV's storage engine). Envoy remains C++ for maximum proxy performance.
Project join years trace the ecosystem's evolution:
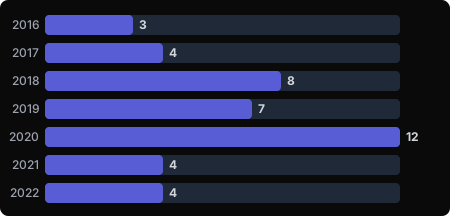
2020 was the explosion year — the COVID-era digital transformation wave drove mass project adoption into CNCF. The cadence has stabilised to 4 projects per year since 2021, suggesting the foundation is now curating for quality and strategic fit rather than volume.
The CNCF itself is listed as the steward for 38 of 42 projects, but the real power lies with the contributing organisations:
This is an open source ecosystem with clear corporate gravity centres — Red Hat and Google exert outsized influence through their project portfolios.
Each category's ratio of internal edges (edges between projects in the same category) to cross edges (edges connecting to other categories) reveals how integrated each domain is:
| Category | Internal | Cross | Internal % |
|---|---|---|---|
| Observability | 6 | 6 | 50%% |
| Orchestration | 9 | 28 | 24%% |
| Service Mesh | 3 | 3 | 50%% |
| App Definition | 2 | 6 | 25%% |
| CNAI | 2 | 2 | 50%% |
| Provisioning | 1 | 3 | 25%% |
| Platform | 0 | 6 | 0%% |
| Data | 0 | 2 | 0%% |
| Runtime | 0 | 2 | 0%% |
| Serverless | 0 | 2 | 0%% |
Observability and Service Mesh have the highest internal cohesion — these projects are designed to work together as stacks. Platform, Data, Runtime, and Serverless have zero internal edges — these are alternative, not composable, tools within their categories.
Kubernetes dependency is near-total. 88%% of CNCF projects depend on Kubernetes (37 of 42 nodes have direct edges). The ecosystem is a single-platform economy. Remove Kubernetes and the graph fragments into 17 disconnected islands.
Observability is the most cohesive category. High internal edge density (50%%) reflects strong interoperability standards (OpenMetrics, OTLP). Observability projects are designed as a stack, not a menu.
Adoption does not equal centrality. etcd and CoreDNS have 81%% and 76%% production adoption but degree-1 graph positions — they are invisible infrastructure. Envoy has 33%% adoption but degree-3 centrality — it is an architectural choice point with wide integration surface but uneven deployment.
Service mesh and App Definition compete internally. Istio vs Linkerd, Argo vs Flux, Helm vs Kustomize — parallel projects solving overlapping problems. This competition drives innovation but fragments adoption and keeps internal cohesion lower than Observability.
Cloud Native AI is the frontier. Sparse internal edges and peripheral graph positioning signal an emerging category. Milvus (33k GitHub stars) is the standout — a vector database that bridges the gap between Kubernetes infrastructure and AI workloads.
Go is the ecosystem language. 81%% of CNCF projects are written in Go. Rust is the challenger (Linkerd, TiKV), C++ persists where performance is non-negotiable (Envoy), and TypeScript powers the developer experience layer (Grafana, Backstage).
2020 was the inflection year. 12 of 42 projects joined CNCF in 2020 — the year COVID-era digital transformation drove mass cloud native adoption. The pace has since stabilised to 4 per year, reflecting maturation and curation.
The CNCF landscape graph reveals an ecosystem that is mature at its core (Kubernetes + Observability) and experimental at its edges (CNAI, Serverless). The structural dependencies show where the cloud native stack is solidified and where it's still being assembled. For organisations building on this ecosystem, the graph is a map of both stability and risk.